CRL Map: Difference between revisions
Jump to navigation
Jump to search
m reformat top of page |
remove border around #2 |
||
| Line 46: | Line 46: | ||
=== 2. Selecting Infrastructure Overlays === | === 2. Selecting Infrastructure Overlays === | ||
Second, we need to select the specific types of infrastructure we are interested in visualizing. | Second, we need to select the specific types of infrastructure we are interested in visualizing. | ||
{| class="wikitable" style="width:100%; border: 0; background: #f9f9f9;" | |||
{| class="wikitable" style="width:100%;" | |||
|- | |- | ||
| style="width:50%; vertical-align:top;" | | | style="width:50%; vertical-align:top; border: 0;" | | ||
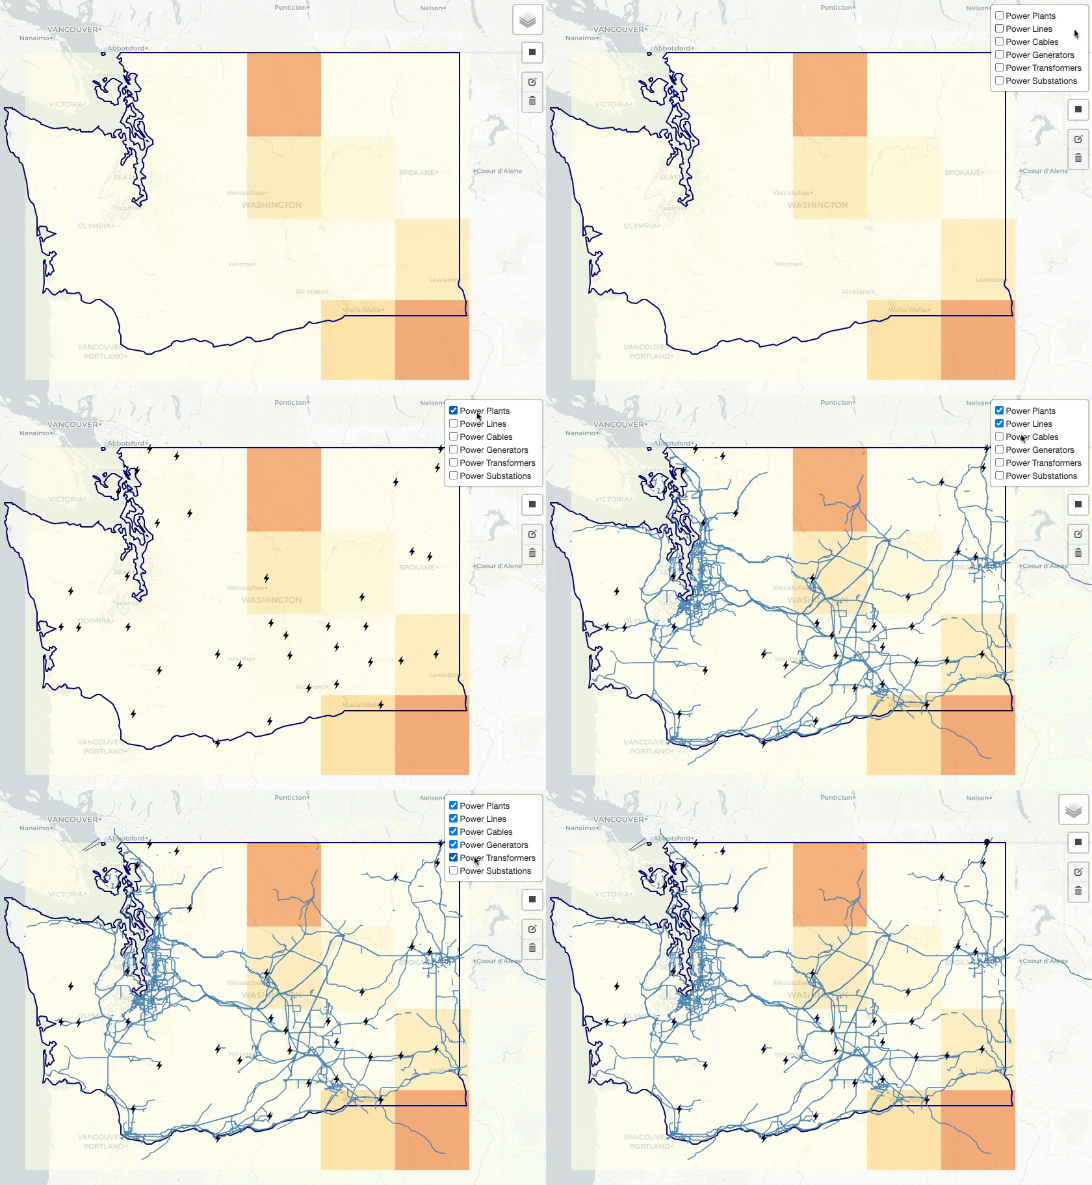
*'''Select Infrastructure Overlays''': On the right-hand side, you'll see a layers icon. Hover over it to reveal the available infrastructure overlays. In this example, the available infrastructure includes specific types of power grid data, which provides insight into its exposure under the selected climate scenario. | *'''Select Infrastructure Overlays''': On the right-hand side, you'll see a layers icon. Hover over it to reveal the available infrastructure overlays. In this example, the available infrastructure includes specific types of power grid data, which provides insight into its exposure under the selected climate scenario. | ||
<div style="display: flex; justify-content: center;"> | <div style="display: flex; justify-content: center;"> | ||
[[File:CRL-Map-Infrastructure-Overlay-2024-10-7.gif|alt=Dropdown Selectors]] | [[File:CRL-Map-Infrastructure-Overlay-2024-10-7.gif|alt=Dropdown Selectors]] | ||
</div> | </div> | ||
|} | |} | ||
Revision as of 20:12, 8 October 2024
Getting Started
Follow this step-by-step guide for a basic overview of the map functionality. The map can be accessed here.
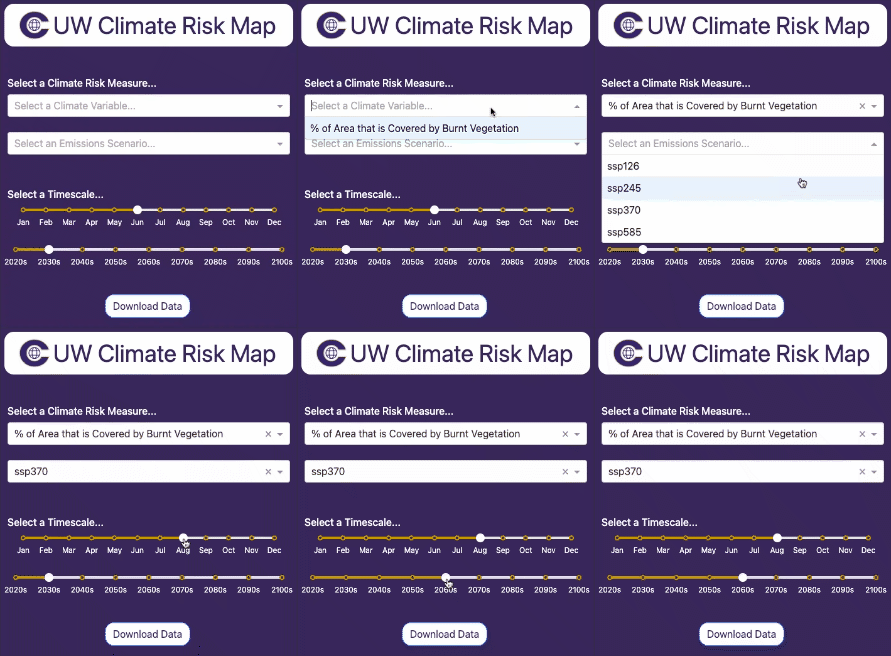
1. Selecting Climate Scenario Parameters
First, we need to select a combination of parameters for the desired climate scenario.
The example on the right illustrates a scenario where the selected measure is "% Area Covered by Burnt Vegetation"—used as a proxy for wildfire risk—under a moderate emissions projection for August in the 2060s.
|
2. Selecting Infrastructure Overlays
Second, we need to select the specific types of infrastructure we are interested in visualizing.
|
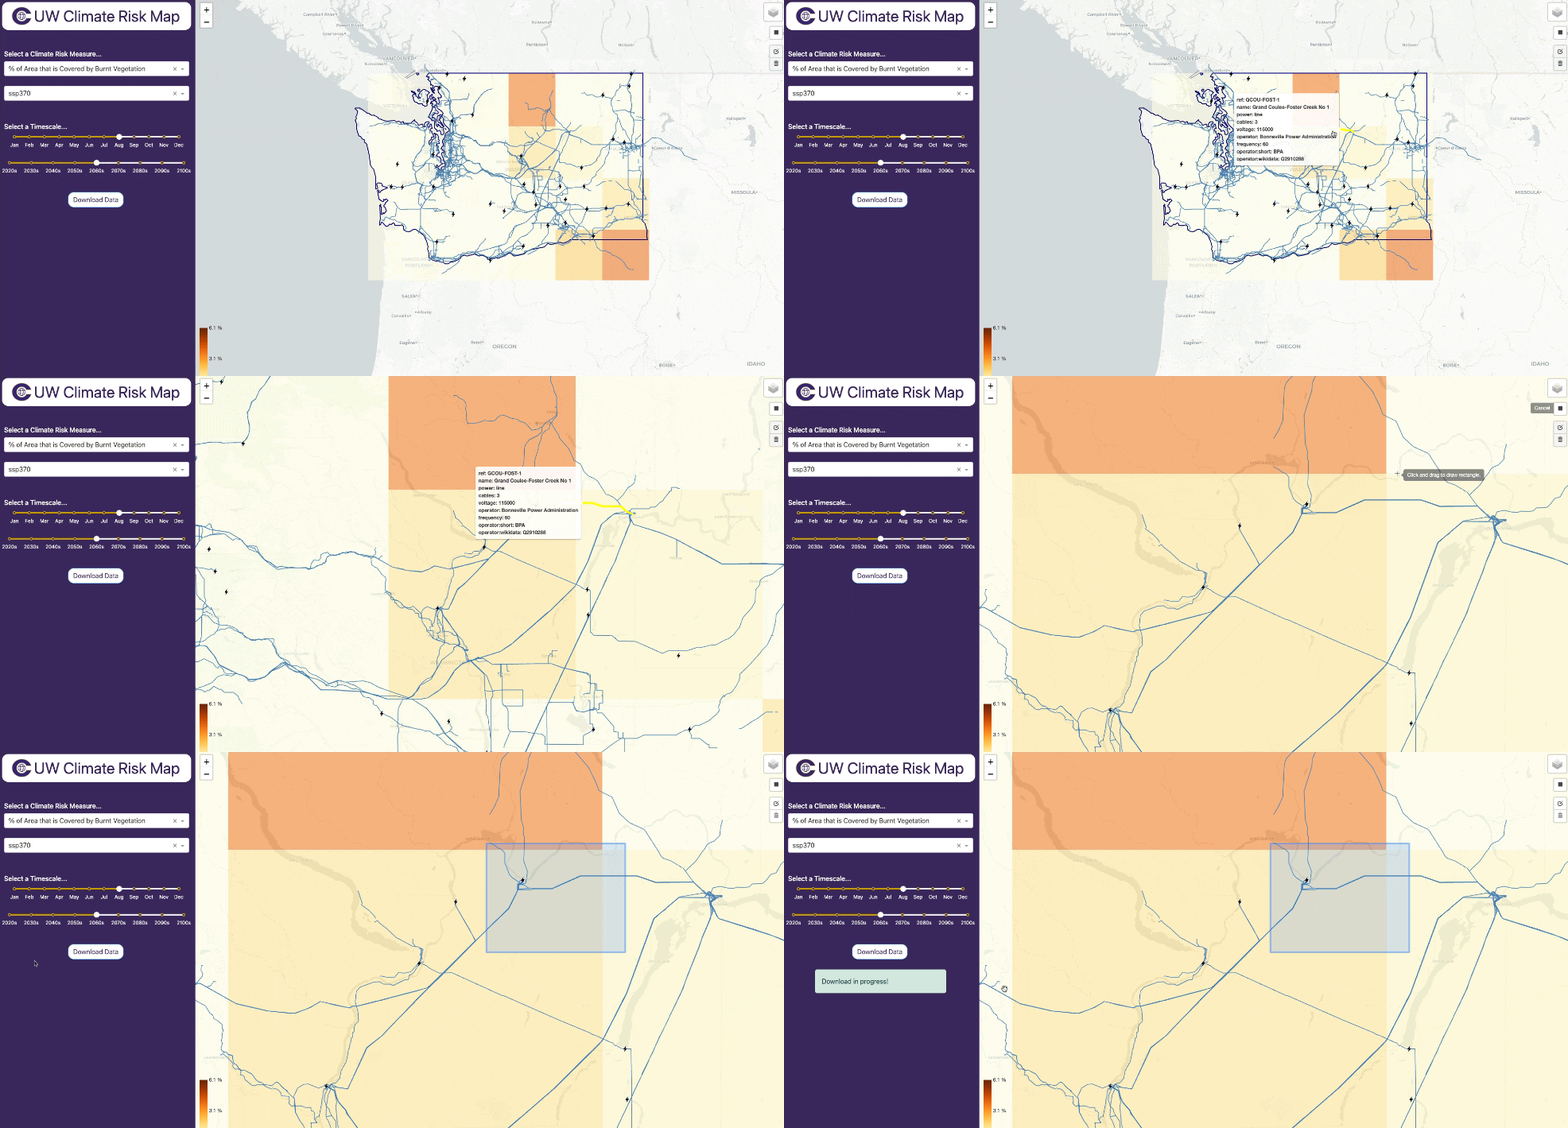
3. Download Data
From here, you can explore the map and your particular areas of interest visually to get a sense of asset exposure. You may wish to download the data to do an offline analysis, which can be done easily.
|


