CRL Map: Difference between revisions
Start methodology and data source section |
Add sample data download table |
||
| Line 73: | Line 73: | ||
=== Download Data Output === | === Download Data Output === | ||
Below is an example of the data structure you might see when you download the CSV file from the Climate Risk Map. For a full list of fields and their descriptions in the download, see '''TO DO'''. | |||
{| class="wikitable" style="width:100%; text-align: left; background: #f9f9f9; border: 1px solid #ddd; margin-top: 20px;" | |||
|- | |||
! OSM ID | |||
! OSM Subtype | |||
! County Name | |||
! Tags | |||
! SSP | |||
! Month | |||
! Decade | |||
! Climate Variable | |||
! Climate Exposure | |||
|- | |||
| 41543109 | |||
| Line | |||
| Douglas County | |||
| {'name': 'Grand Coulee-Chief Joseph No 3', 'power': 'line', 'cables': '3', 'voltage': '500000', 'operator': 'Bonneville Power Administration'} | |||
| 370 | |||
| 8 | |||
| 2060 | |||
| Burnt Fraction All | |||
| 0.945 | |||
|- | |||
| 41543169 | |||
| Line | |||
| Douglas County | |||
| {'power': 'line'} | |||
| 370 | |||
| 8 | |||
| 2060 | |||
| Burnt Fraction All | |||
| 1.445 | |||
|- | |||
| 41543169 | |||
| Line | |||
| Grant County | |||
| {'power': 'line'} | |||
| 370 | |||
| 8 | |||
| 2060 | |||
| Burnt Fraction All | |||
| 1.445 | |||
|- | |||
| 40531749 | |||
| Line | |||
| Douglas County | |||
| {'power': 'line'} | |||
| 370 | |||
| 8 | |||
| 2060 | |||
| Burnt Fraction All | |||
| 2.435 | |||
|- | |||
| 40531749 | |||
| Line | |||
| Grant County | |||
| {'power': 'line'} | |||
| 370 | |||
| 8 | |||
| 2060 | |||
| Burnt Fraction All | |||
| 1.689 | |||
|} | |||
= Methodology = | = Methodology = | ||
Revision as of 23:02, 8 October 2024
Quick-Start Guide
Follow this step-by-step guide for a basic overview of the map functionality. The map can be accessed here.
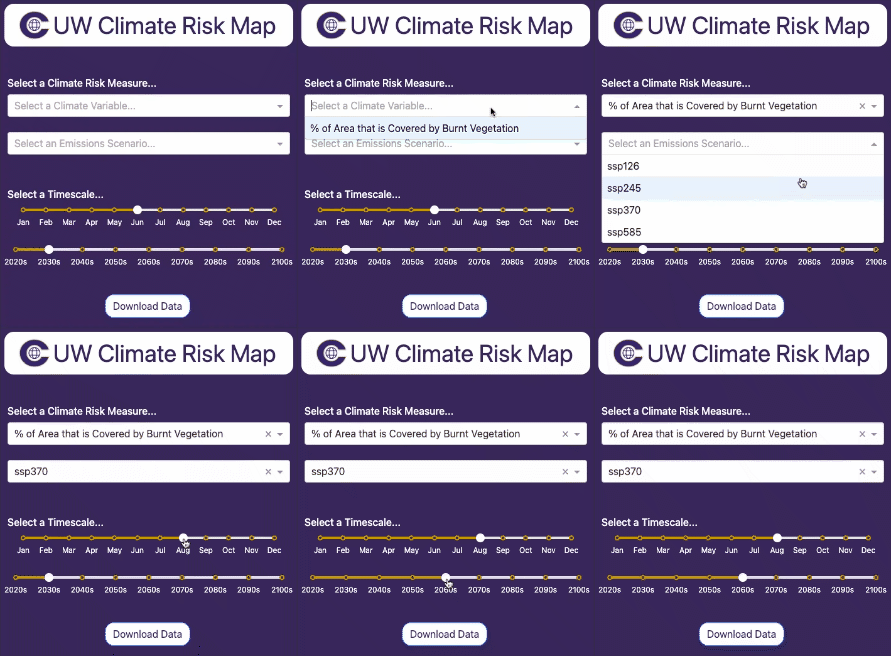
Selecting Climate Scenario Parameters
First, we need to select a combination of parameters for the desired climate scenario.
The example on the right illustrates a scenario where the selected measure is "% Area Covered by Burnt Vegetation"—used as a proxy for wildfire risk—under a moderate emissions projection for August in the 2060s.
|
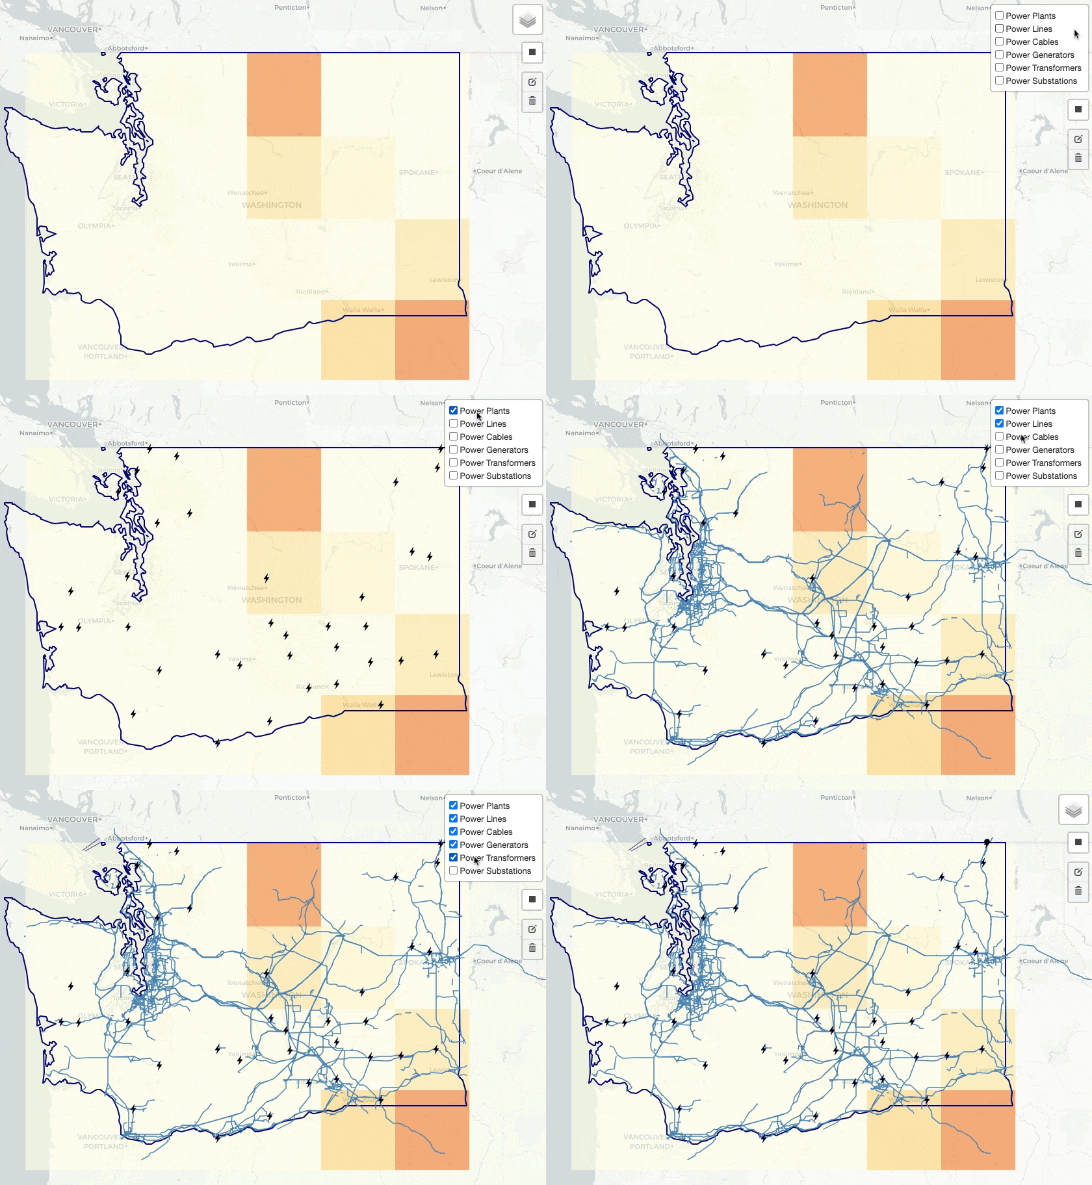
Selecting Infrastructure Overlays
Second, we need to select the specific types of infrastructure we are interested in visualizing.
|
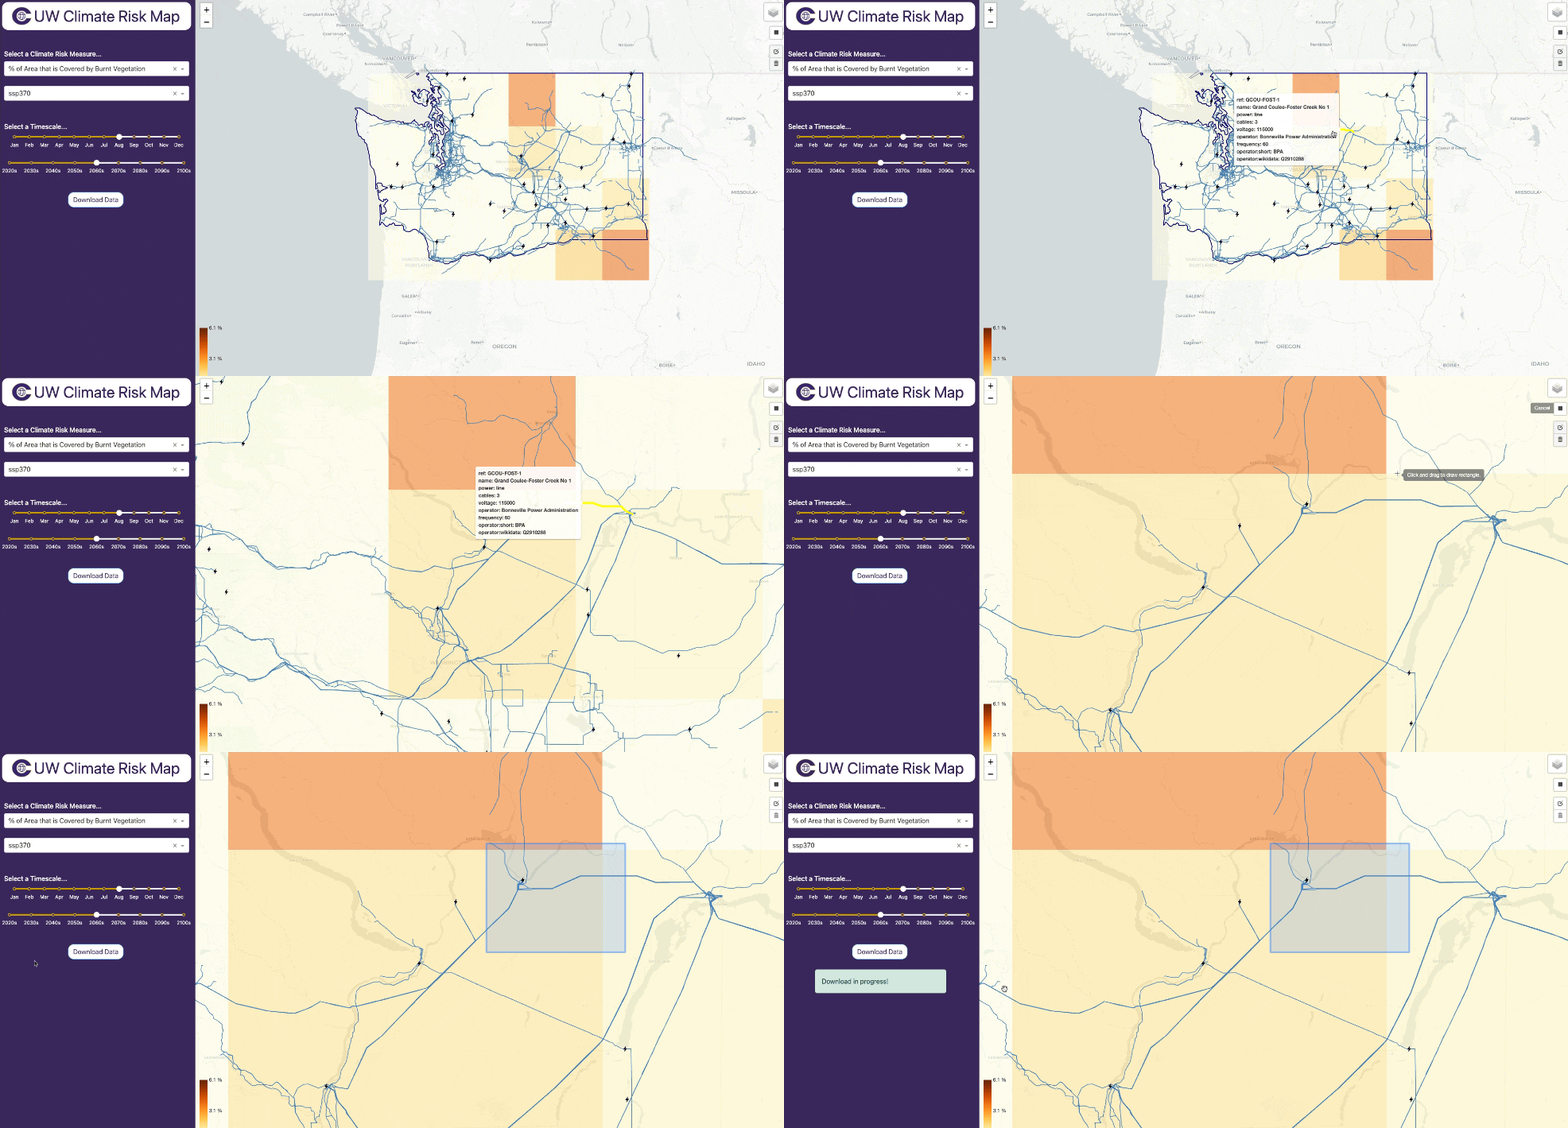
Download Data
From here, you can explore the map and your particular areas of interest visually to get a sense of asset exposure. You may wish to download the data to do an offline analysis, which can be done easily.
|
Download Data Output
Below is an example of the data structure you might see when you download the CSV file from the Climate Risk Map. For a full list of fields and their descriptions in the download, see TO DO.
| OSM ID | OSM Subtype | County Name | Tags | SSP | Month | Decade | Climate Variable | Climate Exposure |
|---|---|---|---|---|---|---|---|---|
| 41543109 | Line | Douglas County | {'name': 'Grand Coulee-Chief Joseph No 3', 'power': 'line', 'cables': '3', 'voltage': '500000', 'operator': 'Bonneville Power Administration'} | 370 | 8 | 2060 | Burnt Fraction All | 0.945 |
| 41543169 | Line | Douglas County | {'power': 'line'} | 370 | 8 | 2060 | Burnt Fraction All | 1.445 |
| 41543169 | Line | Grant County | {'power': 'line'} | 370 | 8 | 2060 | Burnt Fraction All | 1.445 |
| 40531749 | Line | Douglas County | {'power': 'line'} | 370 | 8 | 2060 | Burnt Fraction All | 2.435 |
| 40531749 | Line | Grant County | {'power': 'line'} | 370 | 8 | 2060 | Burnt Fraction All | 1.689 |
Methodology
This section provides an overview of how the Climate Risk Mapping Application is built and the methodology behind its calculations and data processing.
Data Sources
Climate
- % Area that is Covered by Burnt Vegetation: This initial variable for the prototype is sourced from CMIP6 (Coupled Model Intercomparison Project Phase 6), which provides multiple scenarios of future climate conditions.


