CRL Map

From CRL Wiki
Revision as of 19:06, 7 October 2024 by Admin (talk | contribs) (resize top map image)
Jump to navigation Jump to search

Welcome to the Climate Risk Map! This guide will help you get started with using the tool to understand climate-related hazards and their impacts on physical assets. Whether you're new to climate data or an experienced analyst, this guide will walk you through the basics so you can start exploring climate risk insights right away.

Getting Started

Follow this step-by-step guide for a basic overview of the map functionality. The map can be accessed here.

1. Selecting Scenario Parameters

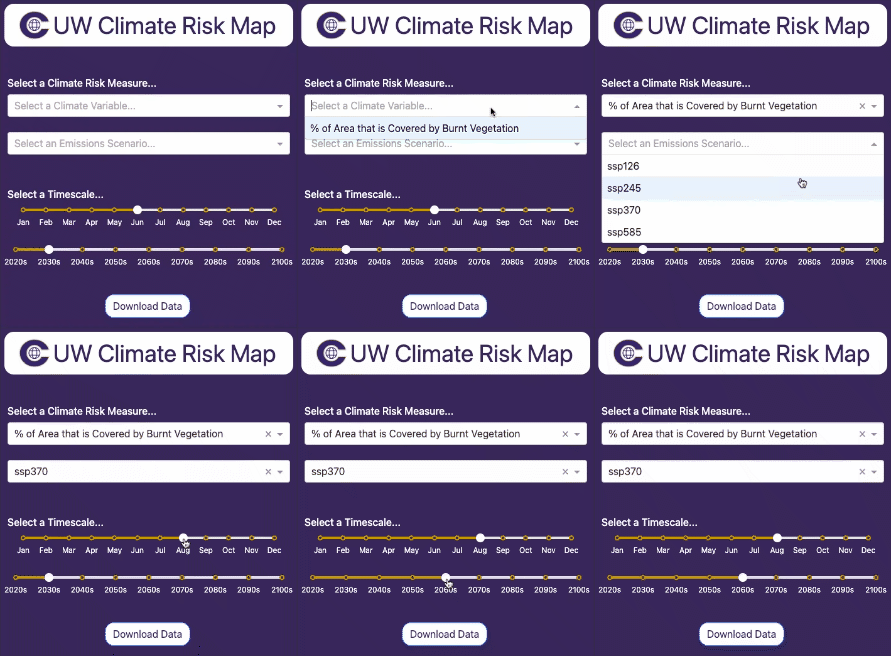
  • Select a Climate Risk Measure: Start by choosing a climate metric of interest from the drop-down menu. These are climate hazards curated by our team that may pose potential risks to infrastructure.


  • Choose a Scenario: Select one of the available climate scenarios (e.g., SSP126 for low emissions, SSP585 for high emissions). Scenarios help you understand potential futures under different climate action pathways.


  • Select a Timescale: Use the timeline slider to choose the time period you are interested in, ranging from the 2020s to the 2100s for all months. This lets you see how climate risks evolve over time for particular months of the year.


The example on the right illustrates a scenario where the selected measure is "% Area Covered by Burnt Vegetation"—used as a proxy for wildfire risk—under a moderate emissions projection for August in the 2060s.

Dropdown Selectors