CRL Map
Aims and Objectives
“40 years ago, the US experienced a billion-dollar disaster every four months. Today, we experience a billion-dollar disaster every three weeks."
Climate change carries significant financial risks to Washington state businesses and local communities, and we need to rapidly develop open-source tools and resources to help decision-makers adapt.
The Climate Risk Map was built with this urgency in mind. As climate-related hazards increase in both frequency and severity, the need for transparent, data-driven tools to assess and mitigate risks has never been more critical. The platform's primary aim is to equip decision-makers with the insights necessary to understand the financial impacts of climate change on infrastructure and assets, allowing for more resilient planning and resource allocation.
- Provide Actionable Insights: Deliver detailed, asset-level risk assessments that allow users to evaluate infrastructure exposure to climate hazards over different time horizons.
- Support Strategic Decision-Making: Enable long-term planning by projecting climate risks across various scenarios, including emissions pathways and time horizons, to help governments and businesses prioritize resources.
- Ensure Transparency and Accessibility: As an open-source platform, the Climate Risk Map offers full visibility into its data sources and models, promoting regulatory compliance and trust in its predictions.
- Promote Adaptation and Resilience: Equip stakeholders, from local planners to financial institutions, with the tools needed to respond proactively to the evolving landscape of climate risks.
By meeting these objectives, the Climate Risk Map seeks to bridge the gap between climate science and practical, real-world decision-making, ensuring that all sectors have the necessary information to build resilience against future climate challenges.
Quick-Start Guide
Follow this step-by-step guide for a basic overview of the map functionality. The map can be accessed here.
Selecting Climate Scenario Parameters
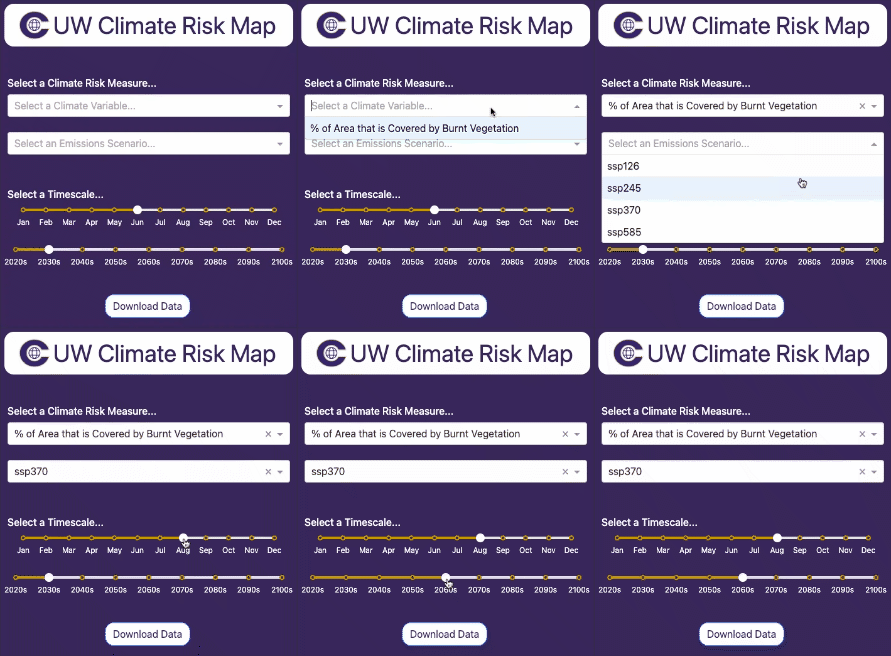
First, we need to select a combination of parameters for the desired climate scenario.
The example on the right illustrates a scenario where the selected measure is "% Area Covered by Burnt Vegetation"—used as a proxy for wildfire risk—under a moderate emissions projection for August in the 2060s.
|
Selecting Infrastructure Overlays
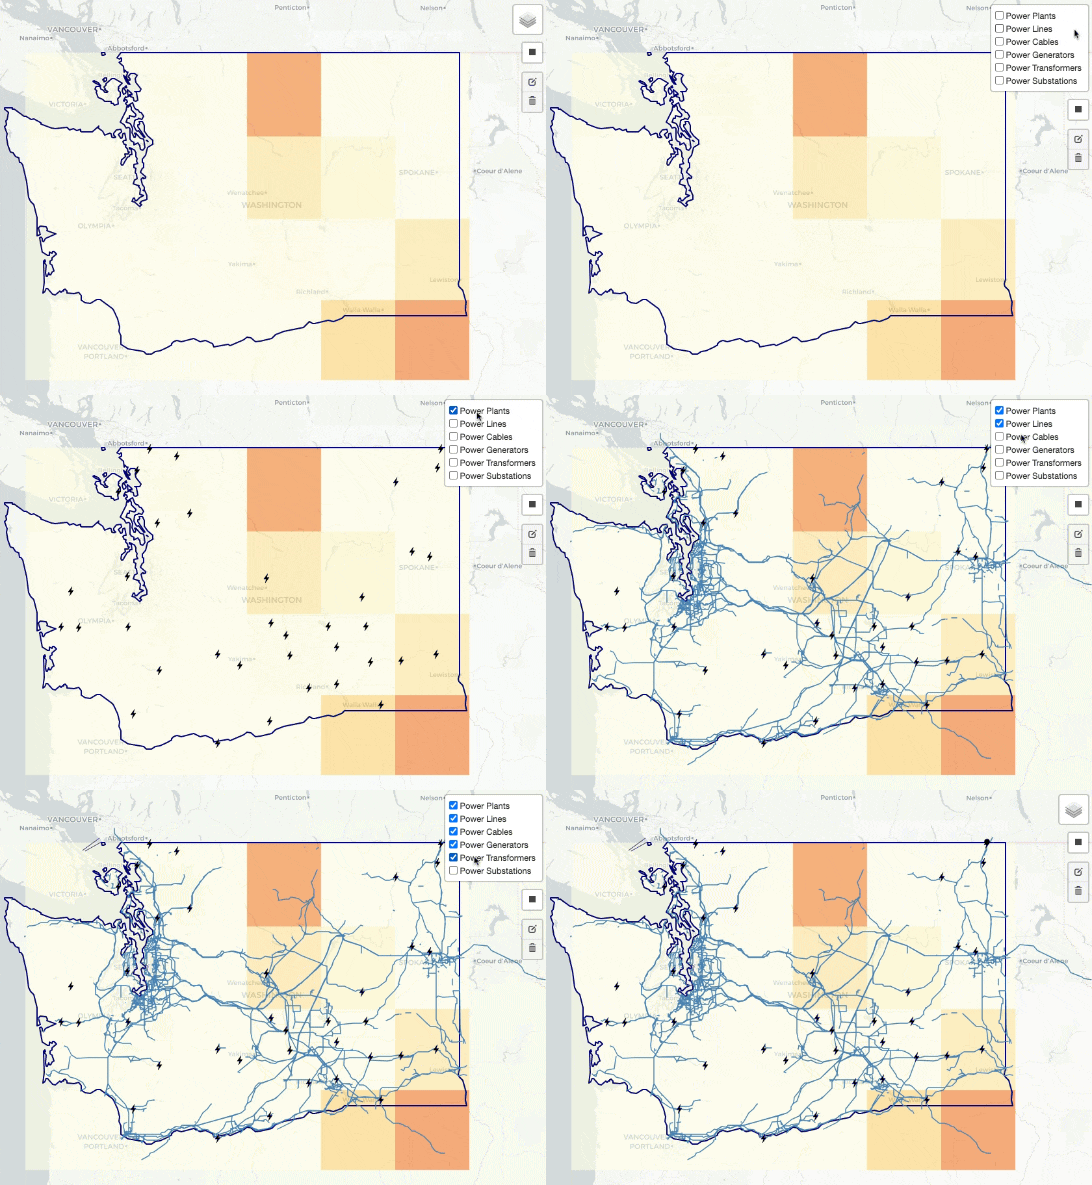
Second, we need to select the specific types of infrastructure we are interested in visualizing.
|
Download Data
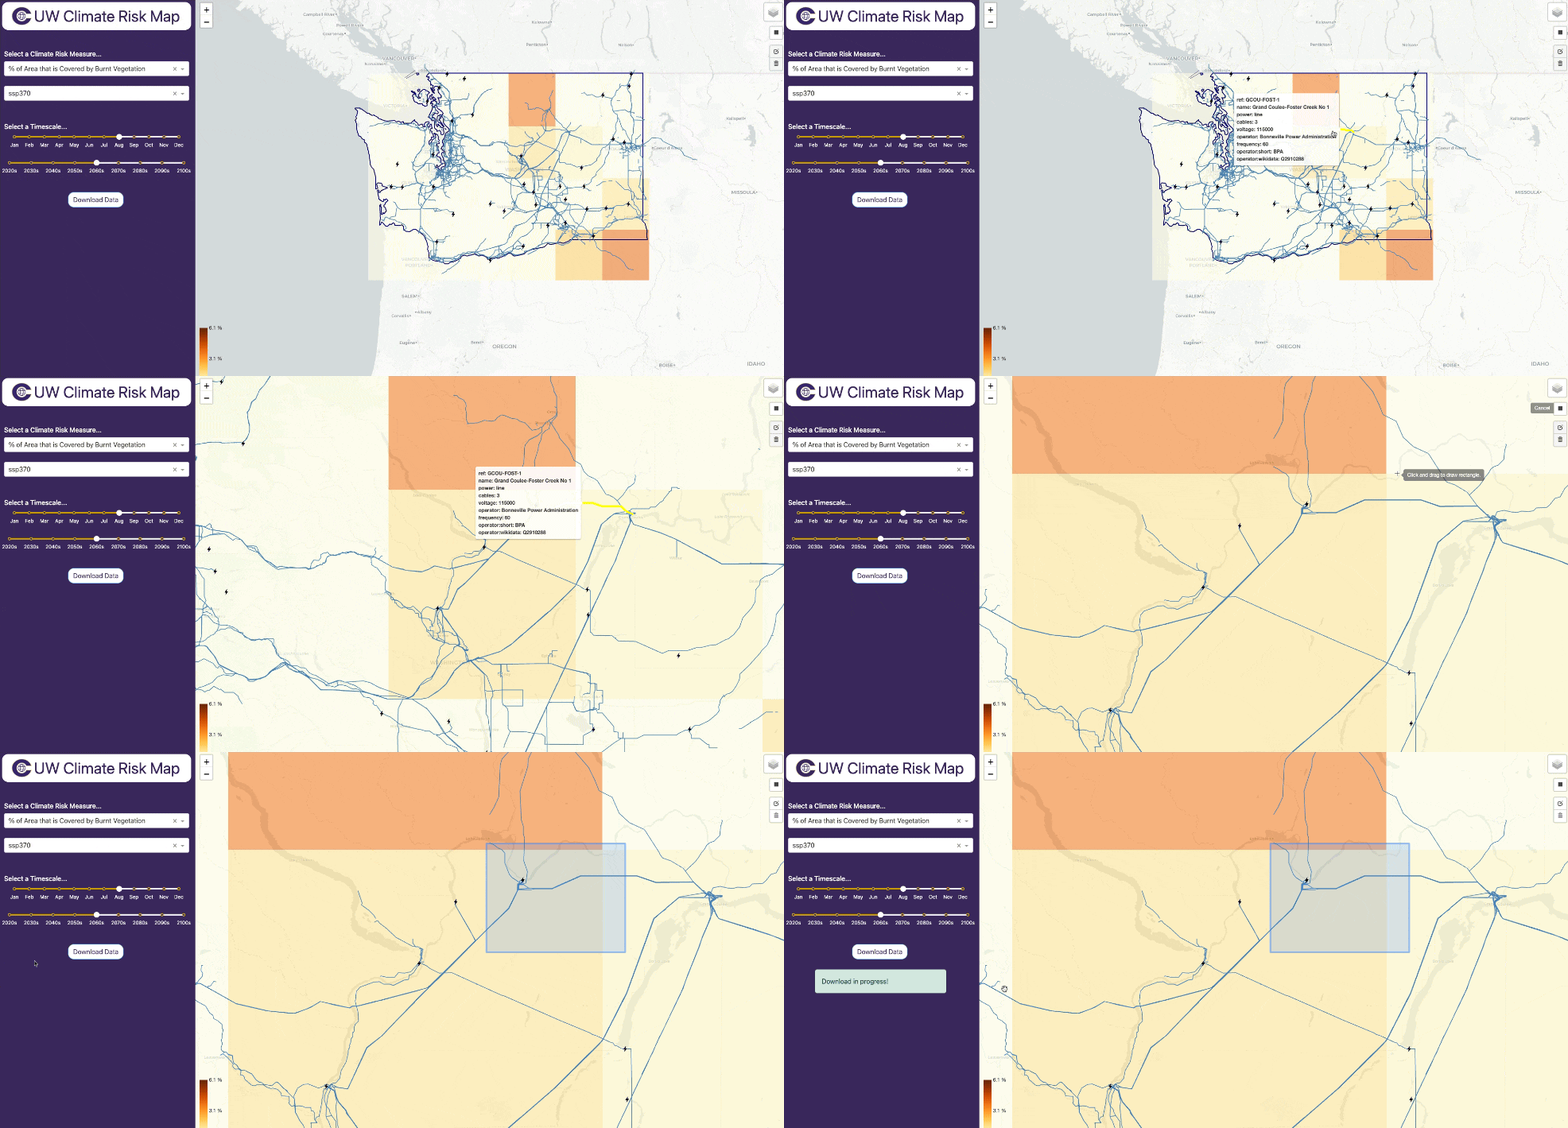
From here, you can explore the map and your particular areas of interest visually to get a sense of asset exposure. You may wish to download the data to do an offline analysis, which can be done easily.
|
Download Data Output
Below is an example of the data structure you might see when you download the CSV file from the Climate Risk Map. For a full list of fields and their descriptions in the download, see TO DO.
| OSM ID | OSM Subtype | County Name | Tags | SSP | Month | Decade | Climate Variable | Climate Exposure |
|---|---|---|---|---|---|---|---|---|
| 41543109 | Line | Douglas County | {'name': 'Grand Coulee-Chief Joseph No 3', 'power': 'line', 'cables': '3', 'voltage': '500000', 'operator': 'Bonneville Power Administration'} | 370 | 8 | 2060 | Burnt Fraction All | 0.945 |
| 41543169 | Line | Douglas County | {'power': 'line'} | 370 | 8 | 2060 | Burnt Fraction All | 1.445 |
| 41543169 | Line | Grant County | {'power': 'line'} | 370 | 8 | 2060 | Burnt Fraction All | 1.445 |
| 40531749 | Line | Douglas County | {'power': 'line'} | 370 | 8 | 2060 | Burnt Fraction All | 2.435 |
| 40531749 | Line | Grant County | {'power': 'line'} | 370 | 8 | 2060 | Burnt Fraction All | 1.689 |
Methodology
This section provides an overview of how the Climate Risk Mapping Application is built and the methodology behind its calculations and data processing.
Data Sources
Climate
- % Area that is Covered by Burnt Vegetation: This initial variable for the prototype is sourced from CMIP6 (Coupled Model Intercomparison Project Phase 6), which provides multiple scenarios of future climate conditions.


